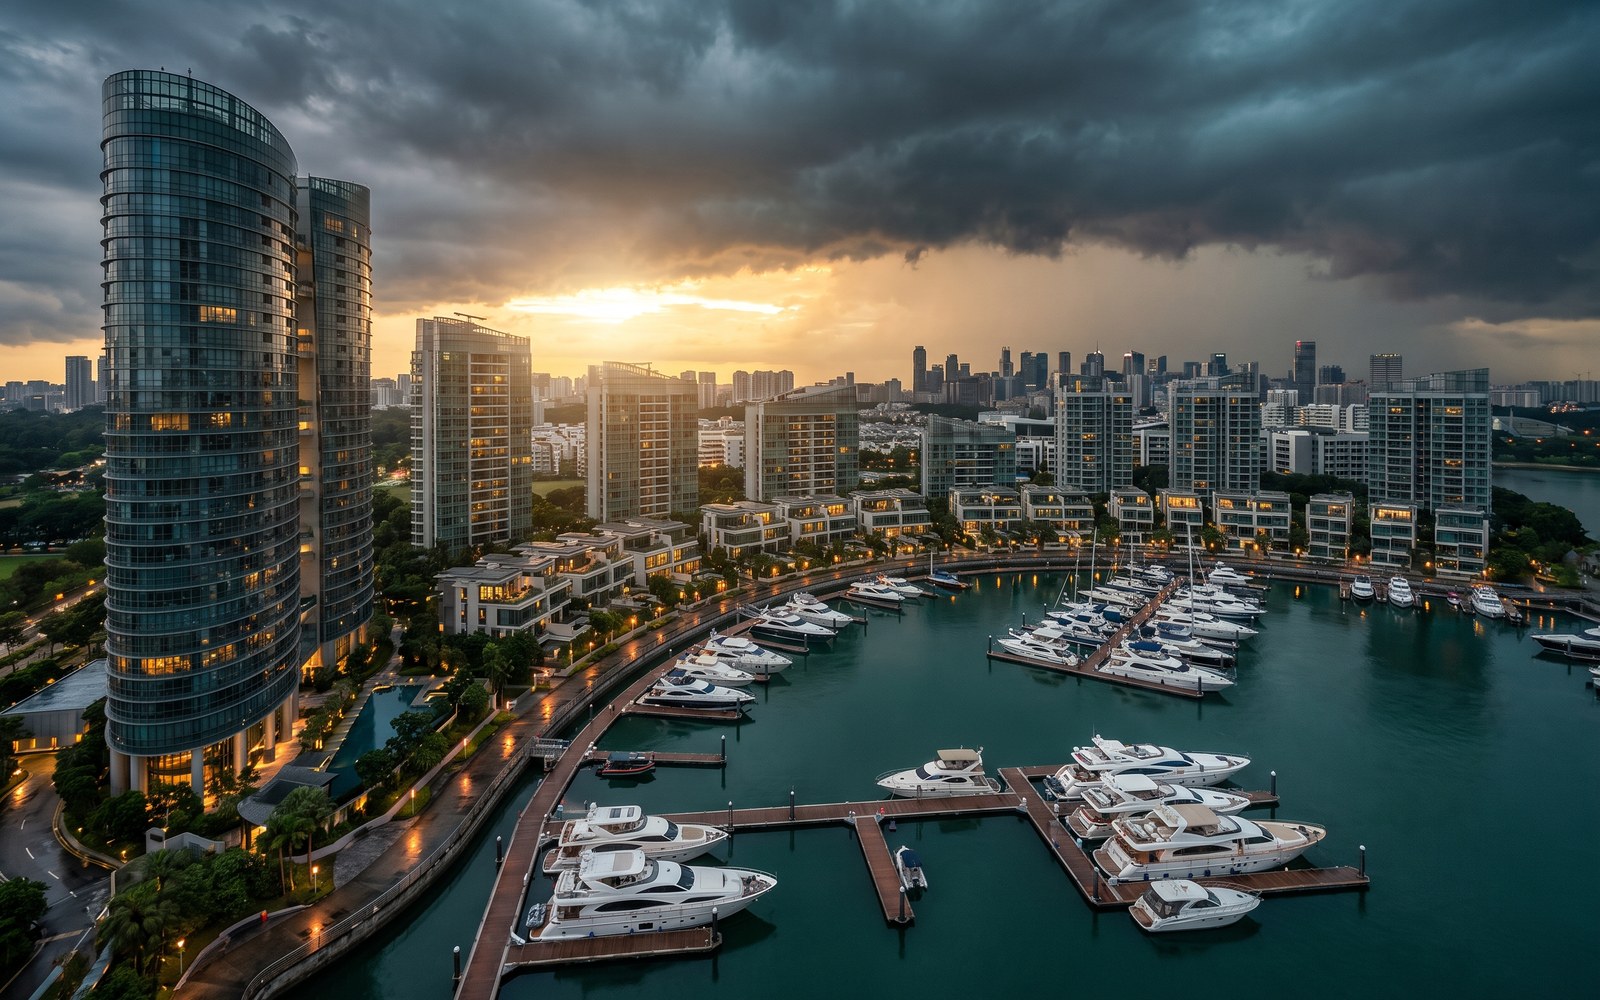
Here are two facts from the same three months of 2026. In the second quarter, Singapore private home prices rose 0.5%, and non-landed prices in the Core Central Region rose 1.8%. In that exact quarter, 4.7% of resale transactions closed at a loss, the highest share in four years, and the five worst deals in the country all came from a single tower on Scotts Road, where sellers gave back between 36% and 48% of what they paid. Losing money in Singapore property is rare. It is also rarely random. The losses cluster in the same kinds of projects, bought the same way, for the same reasons, and that is good news, because a pattern you can see is a pattern you can avoid.
Sources: The Business Times on matched Q2 2026 caveat data; EdgeProp Singapore; URA Realis as analysed by PropNex Research.
How often do Singapore property sellers actually lose money?
About one resale in twenty, and the share is creeping up. The Business Times, tracking matched caveat data, put loss-making private resales at 3.8% in Q3 2025, 3.9% in Q4, 3.7% in Q1 2026 and 4.7% in Q2 2026, the highest reading since the second quarter of 2022. PropNex Research, which matches every resale condo caveat in a month against the unit’s previous purchase price, reads it higher: 5.8% of resale condo deals in April 2026 lost money, and 7.2% in May. The two series use different windows and methods, but they agree on the direction.
Hold the other side of the ledger at the same time. In May 2026 alone, 15% of resale condo transactions, 118 deals, each made more than a million dollars in gross profit. The overwhelming majority of sellers in this market walk away ahead. The point of studying the losers is not fear. It is that the losing minority keeps making the same, identifiable purchase.
What do the record losses actually look like?
They look like Sentosa Cove, and the record book belongs to one project. Seascape is a 151-unit, 99-year leasehold development completed in 2011, and in February 2017 a 4,069 sqft unit there was sold in a mortgagee sale for $6.2 million against a 2010 developer purchase at $12.8 million. The owner, or rather the bank selling on his behalf, gave back $6.6 million, 52% of the price, a 10% annualised decline compounding for six and a half years. When EdgeProp counted the project’s resale record, 20 of Seascape’s 21 resales had lost money, with losses running from $1.3 million to that $6.6 million record.
Gross losses from matched URA caveats, before stamp duties, interest and costs. Sources: EdgeProp Singapore, The Business Times (Cushman & Wakefield data).
| Project | Sold | Loss | Why it lost |
|---|---|---|---|
| Seascape, Sentosa Cove · D4 | Feb 2017 | $6.6m (52%) | Mortgagee sale of a $3,146 psf launch buy rent could never carry |
| Marina Bay Residences · D1 | Aug 2025 | $3.2m (39%) | Bought at $3,500 psf near the 2022 peak, sold 3.2 years later |
| Reflections at Keppel Bay · D4 | Jul 2025 | $1.38m (33%) | First-storey unit; project average down 14.6% since 2013 |
| The Scotts Tower · D9 | Jun 2026 | $1.02m (48%) | Investor-format product; ABSD removed its buyer pool |
| OUE Twin Peaks · D9 | 2025 | $1.0m | Paid $2,919 psf into a project then averaging $2,647 |
Now leave the island, because the pattern travels. Reflections at Keppel Bay, the sculptural District 4 waterfront icon, logged 29 loss-making resales in 2025 alone, three of them above a million dollars. Its biggest was a first-storey three-bedder bought in 2013 at $2,412 psf and exited at $1,616, in a project whose average price has fallen 14.6% since 2013. Marina One Residences in District 1 went 30 losses to a single profit last year, its average down 19.9% since 2018. OUE Twin Peaks in District 9 went 19 to one, its worst seller having paid $2,919 psf into a project that averaged $2,647 at the time. And the biggest single loss of Q3 2025 sat at Marina Bay Residences: bought at $3,500 psf in June 2022, near the top of the post-Covid run, sold 3.2 years later at $2,144 psf. That is $3.2 million surrendered to a peak entry and a short hold, a 14.2% annualised loss.
Each project has its own autopsy, and EdgeProp’s reading of the 2025 loss table adds a detail worth keeping. The heavy losers tend to sit in amenity gaps: Reflections has no school within a kilometre and its nearest mall is further than that; Marina One has three MRT stations in walking distance but no major mall or school. Buyers paid launch premiums for architecture and skyline. The resale market, it turns out, pays for schools, groceries and hawker centres.
Why did five units in one Scotts Road tower lose 36% to 48%?
Because the buyers those units were designed for were priced out of the market by policy, and rent set the floor for what was left. The Scotts Tower is a 231-unit, 103-year leasehold project off Orchard Road, completed in 2016, with roughly nine in ten of its units as one- and two-bedders of about 624 to 907 sqft. In Q2 2026, the five biggest percentage losses in the country were all resales here: five units bought for a combined $13.6 million, four of them in 2012, at $3,240 to $3,649 psf, and resold for $7.9 million, at $1,762 to $2,156 psf. That is $5.7 million returned to the market in a quarter when prices in the surrounding region rose 1.8%.
Follow the exit buyer and the mystery dissolves. A compact, prime, investment-format unit sold in 2012 into a pool dominated by foreigners, investors and companies. Policy then walked that pool out of the room in stages: ABSD for a foreign buyer rose from 10% in 2012 to 60% today, for a company to 65%, and TDSR capped what any single-income buyer could borrow. The buyer who remained was local and yield-minded, and at rents of $3,850 to $4,800 a month, a one-bedder only makes sense at the new price, where the gross yield clears 4%, not at the 2012 price, where it sat near 2%. The 2026 prices are not the anomaly. The 2012 prices were.
Who actually bought into the projects that lost money?
Mostly not Singaporeans, and that is the whole story in one table. URA records compiled on EdgeProp’s project pages show every development’s buyer mix, and the loss projects share a signature. The Scotts Tower sold 74.3% of its units to foreigners, PRs and companies, and only 8.1% of its buyers came from HDB addresses. Compare High Park Residences in Sengkang, which filled the top of the Q3 2025 profit tables: 80.1% Singaporean, with 69% of buyers arriving from HDB addresses. The losers were sold to the buyers ABSD later priced out. The winners were sold to upgraders no cooling measure has ever touched.
Buyer profile by residential status and purchaser address. URA records as shown on EdgeProp project pages, September 2026.
| Project | Singaporean | PR / foreigner / company | From HDB addresses |
|---|---|---|---|
| The Scotts Tower · D9 | 25.7% | 74.3% | 8.1% |
| Marina One Residences · D1 | 52.7% | 47.3% | – |
| Reflections at Keppel Bay · D4 | 57.3% | 42.7% | – |
| High Park Residences · D28, top gainer | 80.1% | 19.9% | 69.0% |
What did every one of these losses have in common?
Six conditions, and a bad postcode is not one of them. In Q3 2025, 62% of loss-making deals were in the prime Core Central Region, 31% on the city fringe, and just 6% in the suburbs. The losses live at the good addresses, which is why we have written before that a great location can still be a bad buy. The pattern that repeats across the record book looks like this:
What five checks protect your next purchase?
Run the record book backwards and the checklist writes itself. None of these takes longer than an evening, and together they screen out every loss pattern above before a cheque is written.
Does a rising market protect you?
No, and Q2 2026 is the cleanest proof on record. The index rose 0.5%, the Core Central Region rose 1.8%, and five units on Scotts Road lost up to 48% inside the same twelve weeks. The average is made of thousands of projects that do not share your unit’s fate, and it cuts the other way too: in 2020, the sharpest GDP fall Singapore has recorded, home prices went up. The market decides the tide. Your project, your format and your entry price decide your boat.
The market publishes its losses in the caveat record for anyone willing to read them. Most buyers never look. The ones who do buy differently, and it shows up years later, in the only column that matters.
Run the five checks on your shortlist with us →
Sources
- The Business Times: Loss-making private home resale deals rise in Q2 as price growth moderates
- The Business Times: Loss-making private home resale deals inch up in Q3 amid economic uncertainty
- EdgeProp Singapore: Lessons learnt from last year’s most unprofitable condos
- EdgeProp Singapore: $6.6 million loss at Seascape mortgagee sale (via Yahoo Finance)
- PropNex Research: Resale Condo Market Watch, May 2026
Shortlisting a unit and want the loss patterns checked against it before you commit? We run the exit-buyer, rent and like-for-like tests on your actual shortlist, with BuySafe on the table and no sugar-coating.
Keep reading
Related notes.
Mortgagee sales just hit a five-year high. Here is what actually happens if you can’t pay your mortgage.
What happens if you can’t pay your mortgage in Singapore: 216 mortgagee sale listings hit the market in 1H 2026, a five-year high. The real sequence is slower and more negotiable than the auction headlines suggest, for both HDB and bank loans, if you act while the loan is still current.
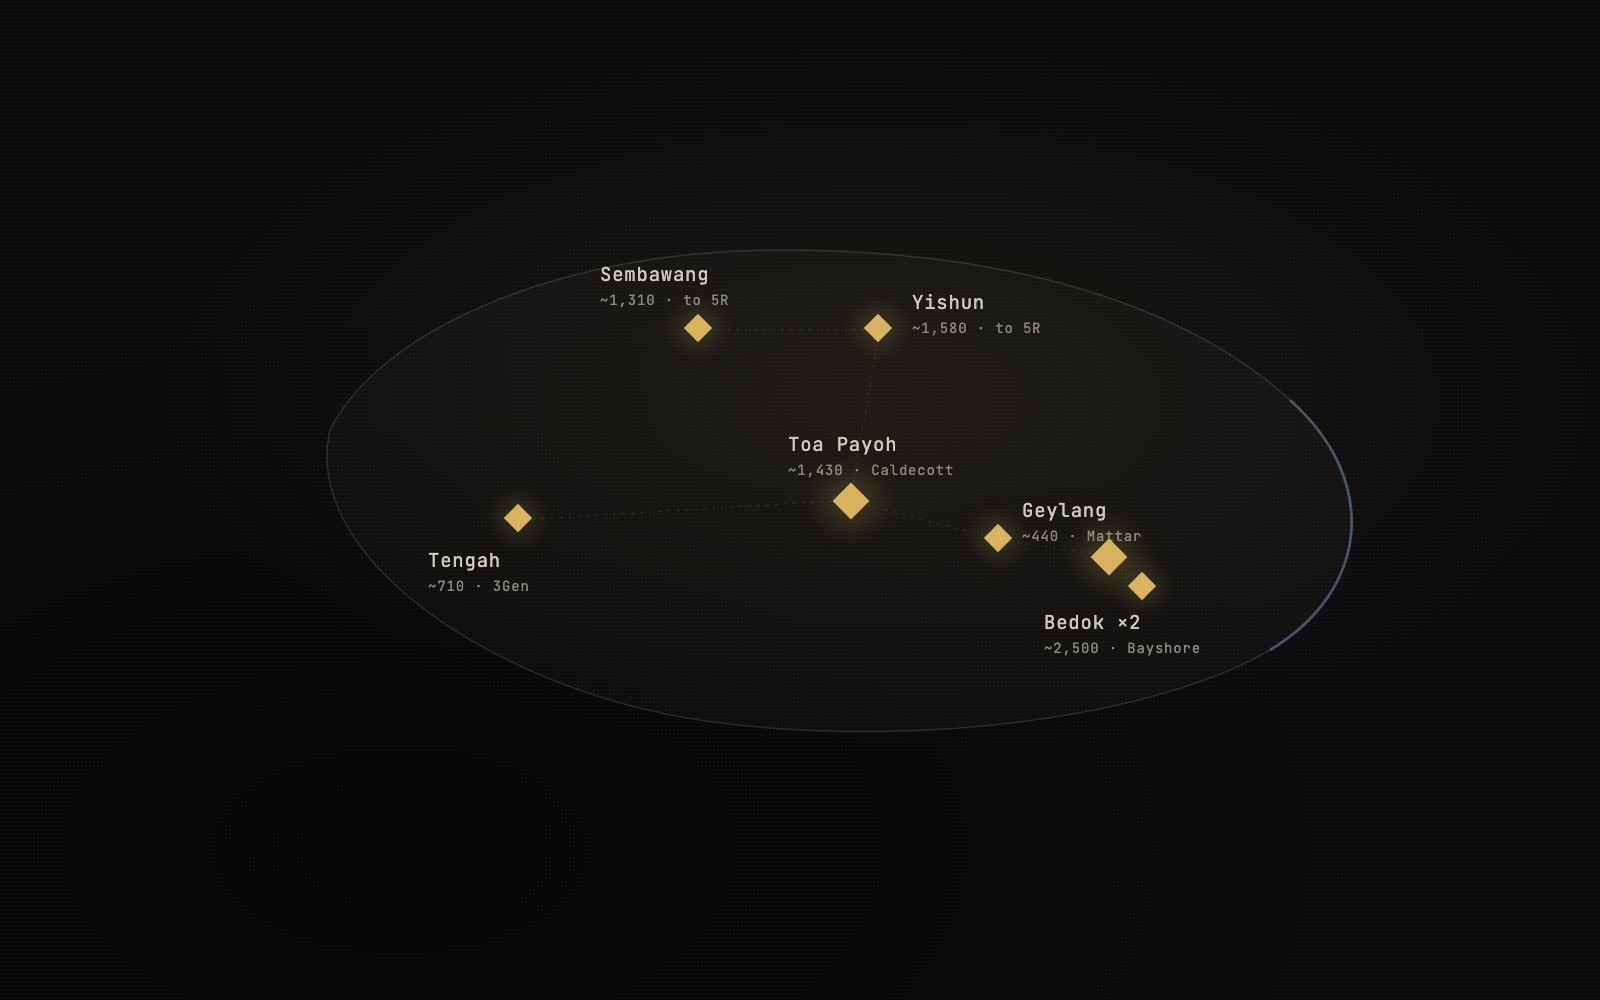
The November BTO guide: 7,960 flats, six towns, and a deadline in September.
About 7,960 flats across Bedok, Geylang, Sembawang, Tengah, Toa Payoh and Yishun, in the first exercise under the $16,000 income ceiling. The paperwork deadline lands 25 September, and the ballot maths this round is stranger than it looks.
Can you buy a second property in Singapore? Here’s the real cost.
Yes, any citizen, PR or foreigner can buy a second property in Singapore. What changes is the bill: 20% ABSD for a citizen, 30% for a PR, 60% for a foreigner, and a loan capped at 45% instead of 75%. The full cash and CPF picture, worked on a $1.5m example.
How these numbers are made. Loss figures are gross, from matched URA caveats: a resale set against the same unit’s previous purchase price. They exclude rental income collected over the holding period, and also exclude stamp duties, interest, taxes, maintenance and commissions, so a true cash outcome can be better or worse than the headline. Quarterly loss shares (Business Times) and monthly matched-caveat shares (PropNex Research) use different windows and methods and will not reconcile exactly. Buyer-profile figures for The Scotts Tower are indicative, as reported. Not financial advice: BuySafe provides market analysis based on historical, publicly available URA transaction data, for information only. It is not financial, investment, legal or tax advice, and not a recommendation to buy, sell or hold. Past performance is not indicative of future results. BuySafe and The Property Collective are independent and not affiliated with, endorsed by, or connected to the URA or any government agency.