
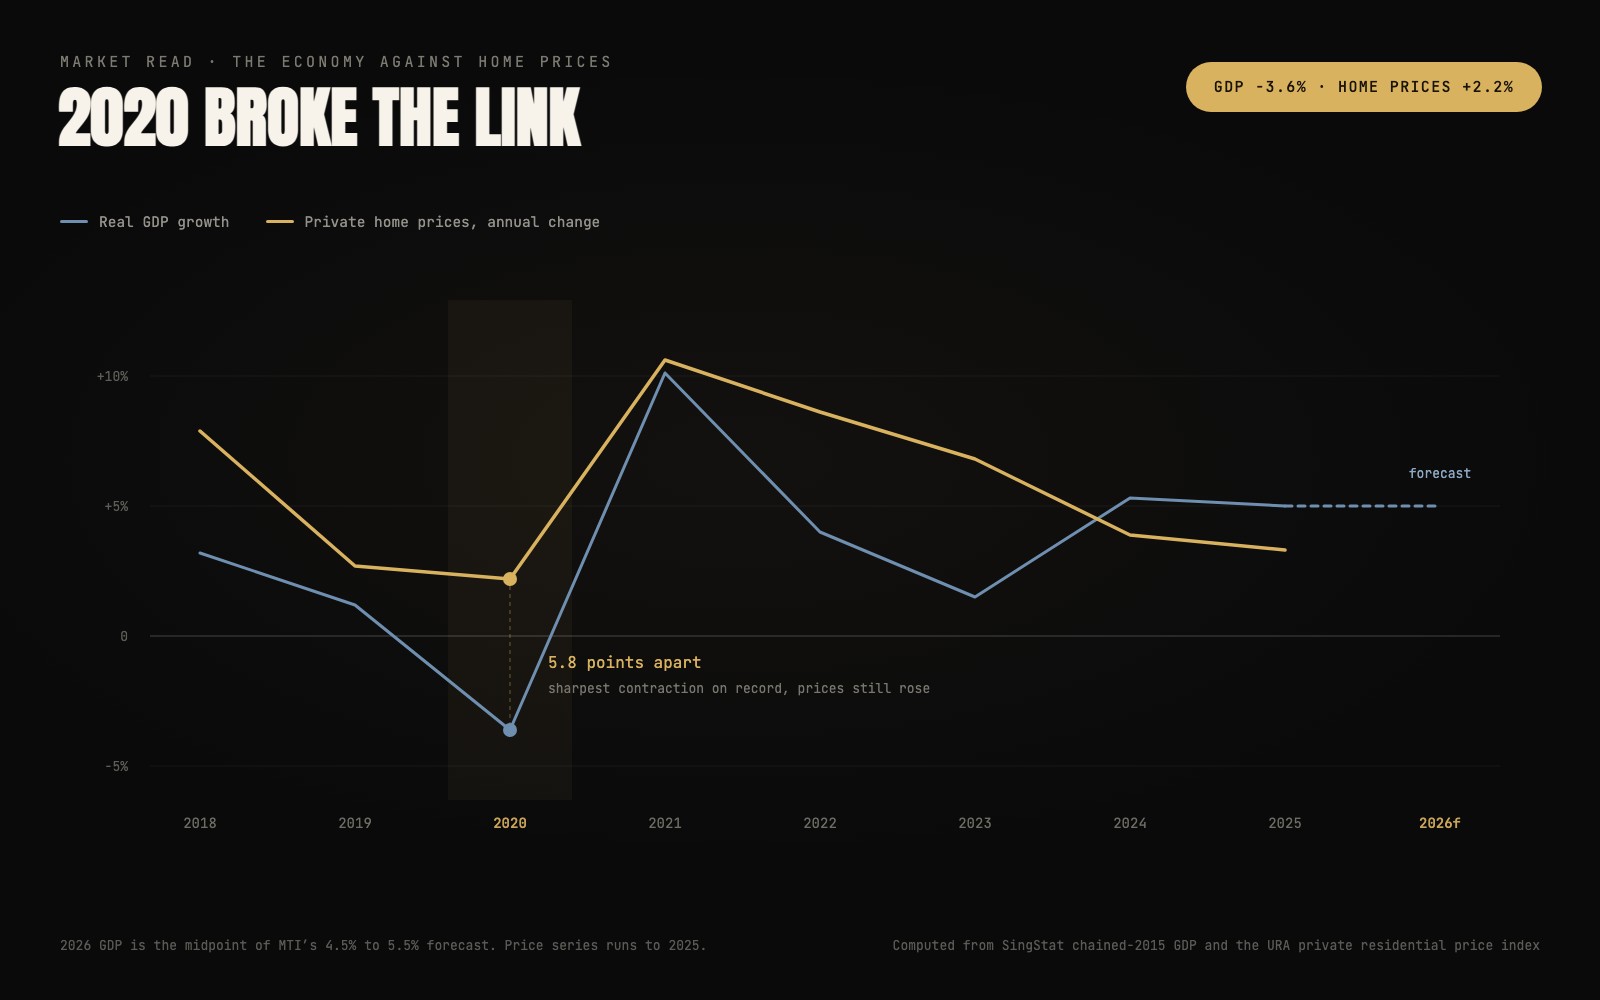
On 11 August the Ministry of Trade and Industry raised its 2026 growth forecast to between 4.5% and 5.5%, up from 2% to 4%, after the economy grew 5.9% in the second quarter and 6.1% across the first half. It is a genuinely strong set of numbers, driven by an AI-related boom in electronics, wholesale trade and banking. The instinct, if you are thinking about buying, is to read it as confirmation that prices are heading up and you should move. Before you do, sit with one uncomfortable pair of official figures. In 2020 the Singapore economy suffered the sharpest contraction in its recorded history, down 3.6% on the official series. Private home prices rose 2.2% that same year. Both numbers come from the government. If GDP drove property prices, that could not have happened.
Sources: MTI, 11 August 2026; SingStat national accounts; URA private residential property price index.
Does a stronger economy actually lift Singapore property prices?
Not directly, and 2020 is the cleanest proof available. GDP does not sit anywhere in the mechanism that sets a transaction price. What sets it is the cost and availability of credit, how much supply is coming, and what the government is willing to allow. GDP touches all three, but slowly and indirectly, and often with the sign you would not expect. In 2020 rates collapsed, supply was disrupted and households had savings they could not spend on travel, so prices rose into a recession. The economy and the housing market were pulling in opposite directions for a year.
This matters because a headline growth upgrade is exactly the kind of thing that makes a buyer feel late. Feeling late is expensive. It is worth being precise about which channels actually carry economic strength into a price, because right now two of them point in different directions.
Why could a stronger economy mean cheaper mortgages, not dearer ones?
Because the Monetary Authority of Singapore does not set an interest rate, and most people reason as though it does. MAS runs monetary policy through the exchange rate, managing the Singapore dollar against a basket of currencies. Local interest rates are therefore largely imported from global markets and then adjusted by what investors expect the Singapore dollar to do. If MAS responds to a strong economy by steepening the currency’s appreciation path, holding Singapore dollars becomes more rewarding on the currency alone, which pushes down the interest rate needed to attract that money. A tightening from MAS tends to pull local rates lower. That is the opposite of what a Federal Reserve hike does, and it is the single most common thing buyers get backwards about this market.
None of which is a promise that mortgages get cheaper. Local rates still take their lead from global ones, and MTI itself flags energy-driven inflation, the possibility of further rate hikes in the Eurozone, and tariff pressure on trade. The honest position is that the rate path is uncertain. The point is narrower: reading a growth upgrade as an automatic rate rise, and therefore a reason to hurry, gets the machinery wrong.
Assessment of how each channel currently points, based on the MTI release of 11 August 2026.
| Channel | How it works | Direction now |
|---|---|---|
| Credit cost | Rates set globally, adjusted by expected S$ appreciation | Unclear, and not simply upward |
| Incomes and jobs | Wage and bonus growth in the sectors that buy homes | Positive, but narrow |
| Policy | Cooling measures respond to prices, not to GDP | The genuine risk |
A strong economy raises the odds of the third channel activating. That is the channel with the fastest and largest effect on a buyer, and the one nobody can hedge.
Which parts of the property market does this growth actually reach?
The narrow parts. Read the composition rather than the headline and the growth is concentrated in electronics and precision engineering, the machinery and equipment side of wholesale trade, and banking. Manufacturing strength of that kind is capital intensive, so it generates far less broad wage growth than an equivalent expansion in services would. Finance and infocomms are the sectors whose bonuses genuinely show up in property, and both are doing well. That supports the prime and city-fringe segments more than it supports everything at once.
The weak spots are just as specific and easy to miss. Food and beverage services contracted, hit by locals travelling out and fewer visitors coming in. The chemicals cluster is the worst affected by Middle East supply disruption. Accommodation remains subdued on elevated travel costs. If your exposure is a shophouse with an F&B tenant, or a retail unit, this GDP upgrade is not your upgrade. Meanwhile MTI expects construction to be supported by a pipeline of public and private projects, which is a reminder that supply is still arriving regardless of how strong the economy looks.
What is the real risk in a strong-growth year?
Policy, and it is not close. Singapore’s cooling measures respond to property prices and household leverage, not to GDP, but a strong economy makes rising prices more likely and therefore makes intervention more likely. The record is consistent: successive rounds of additional buyer’s stamp duty, tighter loan-to-value limits, the total debt servicing ratio framework, and the 2023 move taking foreign-buyer ABSD to 60%. Each arrived in response to price strength. A buyer who stretches to the edge of affordability on the assumption that a strong economy protects them has the risk exactly inverted, because the same strength invites the measure that changes their maths.
This is also why working out what you can genuinely afford under TDSR matters more than any macro forecast. A rule change can move your borrowing capacity overnight. A GDP revision cannot.
What should a buyer or owner do with this number?
The honest summary is that a growth upgrade of this size is good news for Singapore and close to neutral for your specific purchase. The number that should drive that decision is not national output. It is what comparable homes have actually done, adjusted for size and floor so you are comparing like with like, which is the entire reason we built our in-house analysis engine, BuySafe: it estimates real, size- and floor-adjusted price growth across more than 140,000 publicly available URA transactions and 3,000-plus private condo projects, and gives each one a comparable score from 0 to 100. Know the exit before you enter.
Get a free like-for-like read on your project →
Sources
- CNA: Singapore raises 2026 GDP growth forecast to 4.5%-5.5%; economy grew 5.9% in Q2
- SingStat: Gross Domestic Product in chained (2015) dollars, annual
- URA: Private Residential Property Price Index, quarterly (data.gov.sg)
- URA: Release of 4th Quarter 2020 real estate statistics
- MAS: Singapore’s exchange rate-centred monetary policy
Trying to time an entry against the macro picture? The useful question is never what the economy will do, it is what the market has already done to the specific project in front of you. We can read that with you, properly adjusted, before you commit to anything.
Keep reading
Related notes.
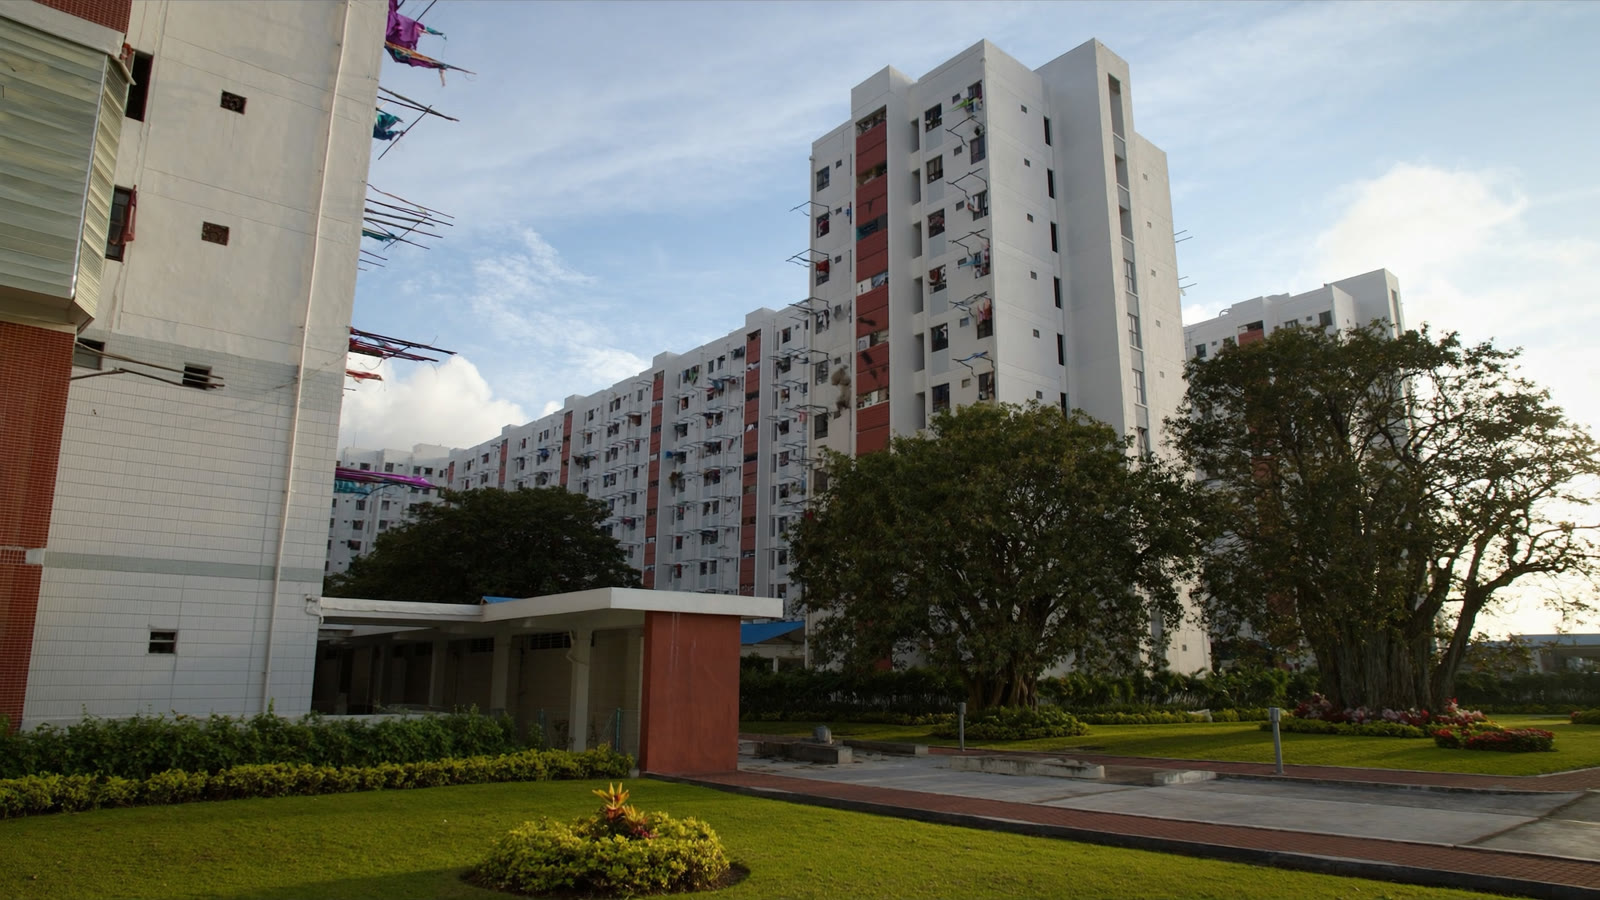
Three quarters down, 0.6% in total. What HDB’s Q3 flash really says about resale prices.
HDB’s flash estimate puts the Q3 2026 Resale Price Index at 202.4, down 0.2% and the third straight quarterly dip, while URA’s private index jumped 1.4%. Volumes rose 17.7%, million-dollar flats hit 597, and the gap between an HDB flat and the condo it is meant to fund widened again. Here is what the number does and does not mean.
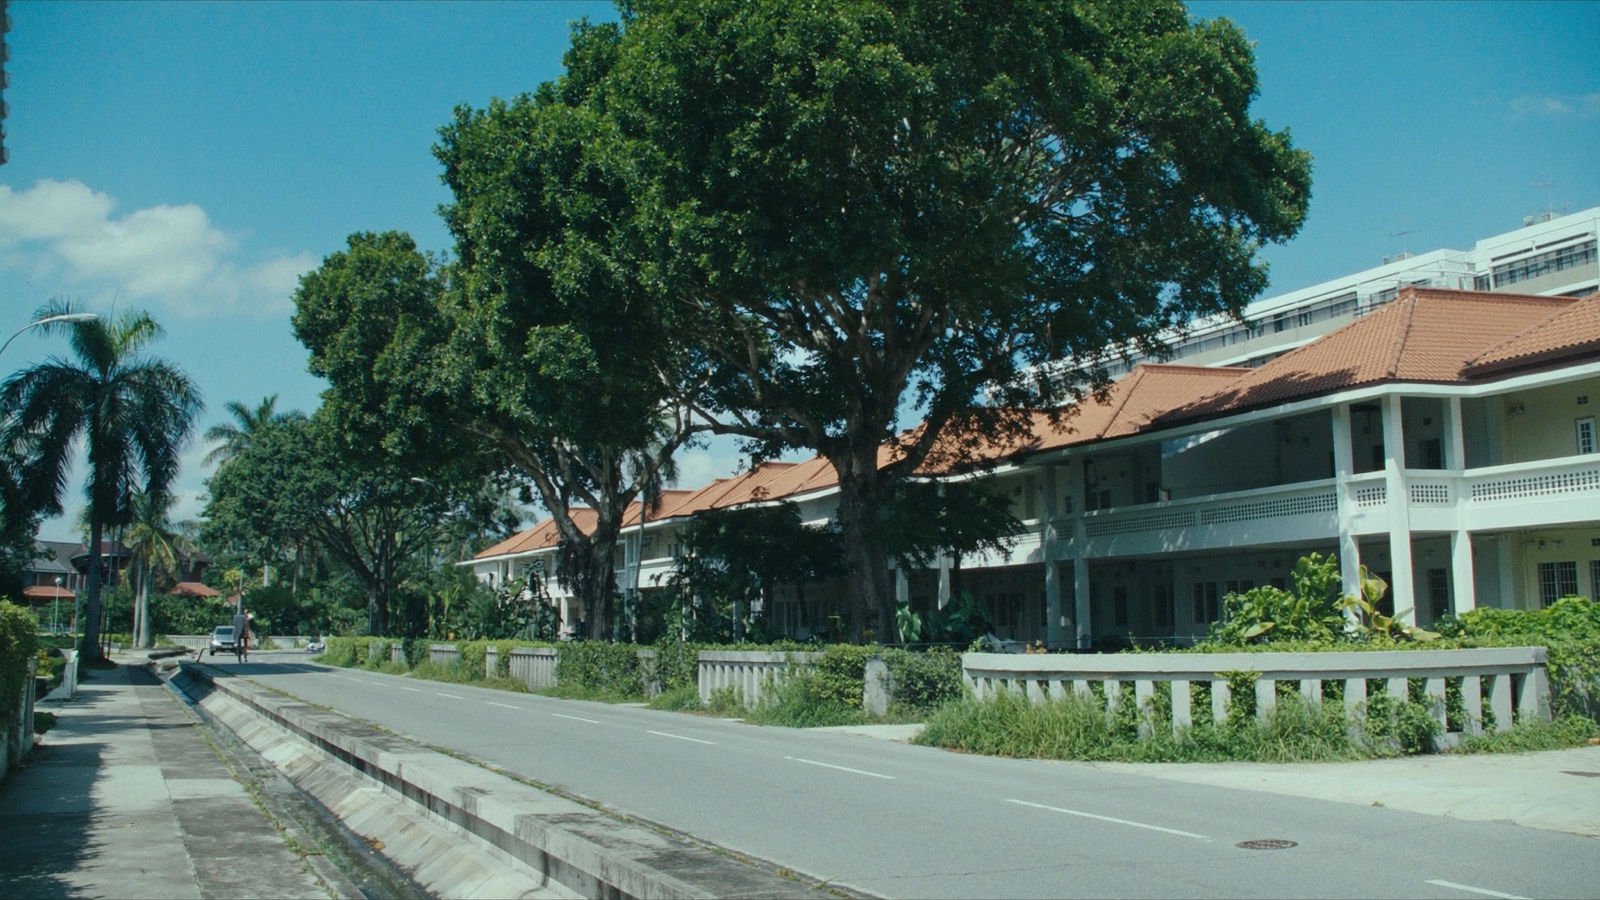
Two new land sales: 85 homes in Siglap now, 235 in Serangoon North later, and what each one prices in.
URA released two residential sites on the same day: a 0.55-hectare plot on East Coast Road, Siglap’s first residential state land since the Seaside Residences site, where every unit must average at least 100 sqm, and a 235-home Reserve List plot at Serangoon North View beside The Garden Residences. One goes to tender on 3 December with analyst calls from $1,100 to $1,650 psf ppr. The other is a signal that says not yet. Here is what each one prices in.
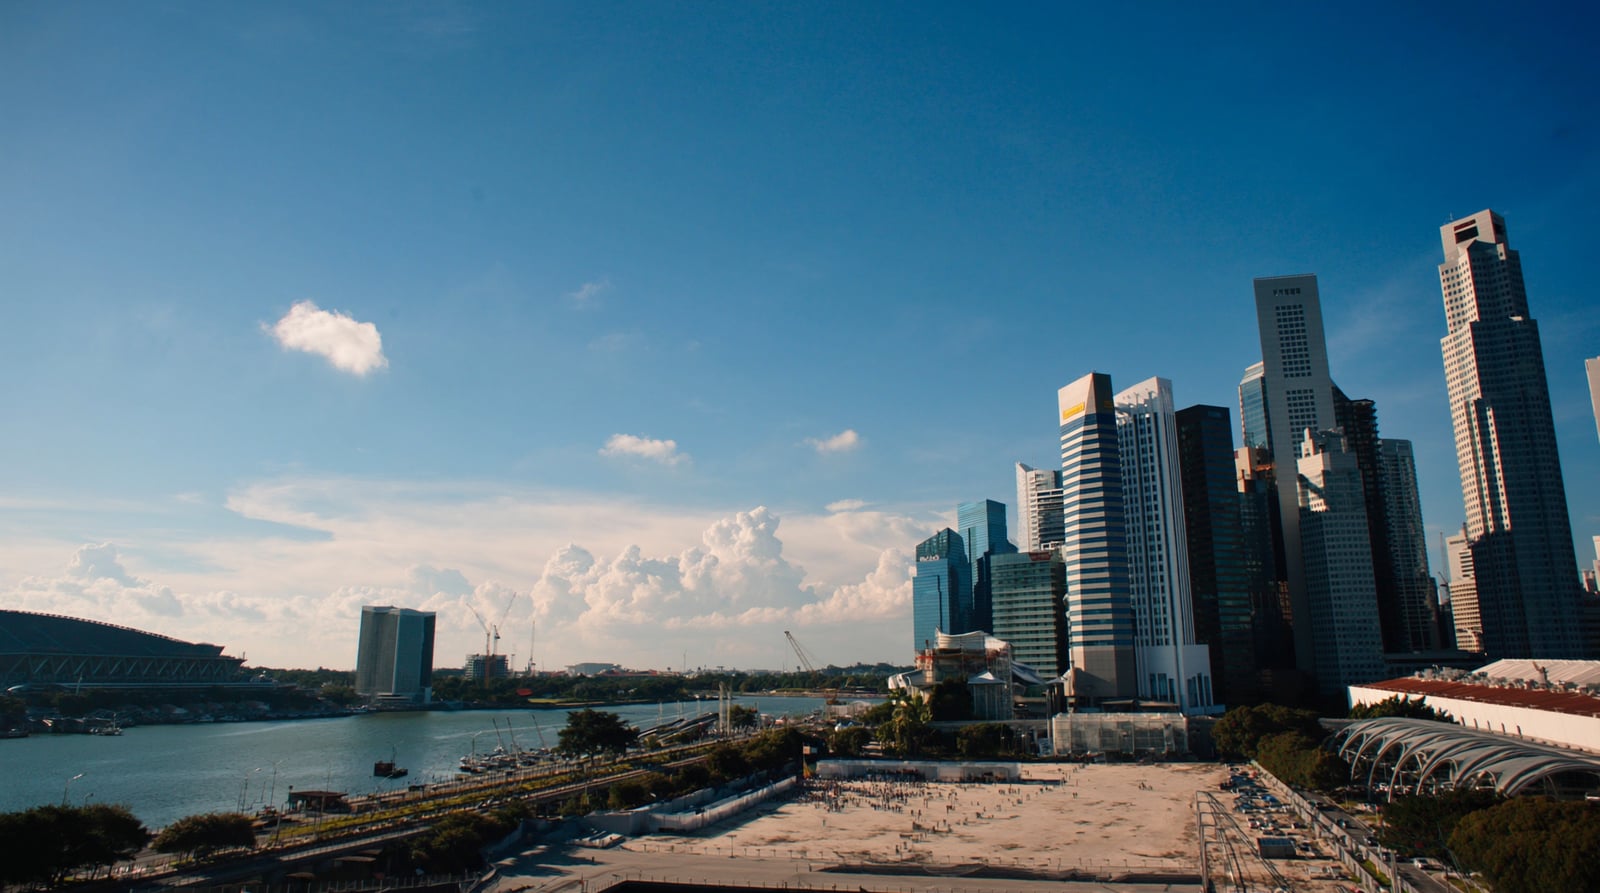
The Fed is not done. What a 73% October and a rising SORA mean for your mortgage.
A week after the first US rate hike since 2023, markets already price a 73% chance of another one in October, and Maybank has lifted its year-end SORA forecast by a third. What the new rate cycle means for Singapore mortgages, for anyone refinancing in the next 12 months, and for buyers waiting on the sidelines.
Figures are official, the reading is ours. The 2026 forecast and quarterly growth figures are from the MTI release of 11 August 2026 as reported by CNA. Annual growth rates are computed from SingStat’s chained-2015 dollar series and annual price changes from URA’s private residential property price index, both as published on their own portals. One note on the 2020 figure: MTI announced a 5.4% contraction in February 2021, and subsequent revisions have moved it to about 3.6%. We use the current series throughout, so the chart and the text agree. The assessment of how each channel currently points is our own judgement, not a forecast by MTI, MAS or URA. This is general information, not advice on your circumstances.
Not financial advice. BuySafe provides market analysis based on historical, publicly available URA transaction data, for information only. It is not financial, investment, legal or tax advice, and not a recommendation to buy, sell or hold. Past performance is not indicative of future results. BuySafe and The Property Collective are not affiliated with, endorsed by, or connected to the URA or any government agency.