Singapore’s private vacancy rate jumped to 7.2% in the third quarter of 2026, from 6.4%, URA said on 23 October. In the same release, private rents rose 1.3%, almost double the previous quarter’s pace, and the non-landed rental indices for the OCR and RCR climbed to the highest levels URA has recorded. Read together, the two numbers look like a contradiction. They are not. One measures keys that have just been handed over; the other measures leases that were actually signed. Here is what each one says, what happened the last time vacancy spiked, and what to do about it if you own or rent a condo.
Sources: URA, Release of 3rd Quarter 2026 real estate statistics and Annexes A-2 and E-1 (23 Oct 2026); URA Realis rental contract count as reported by PropNex and The Business Times (23 Oct 2026).
Why did rents rise when the vacancy rate jumped?
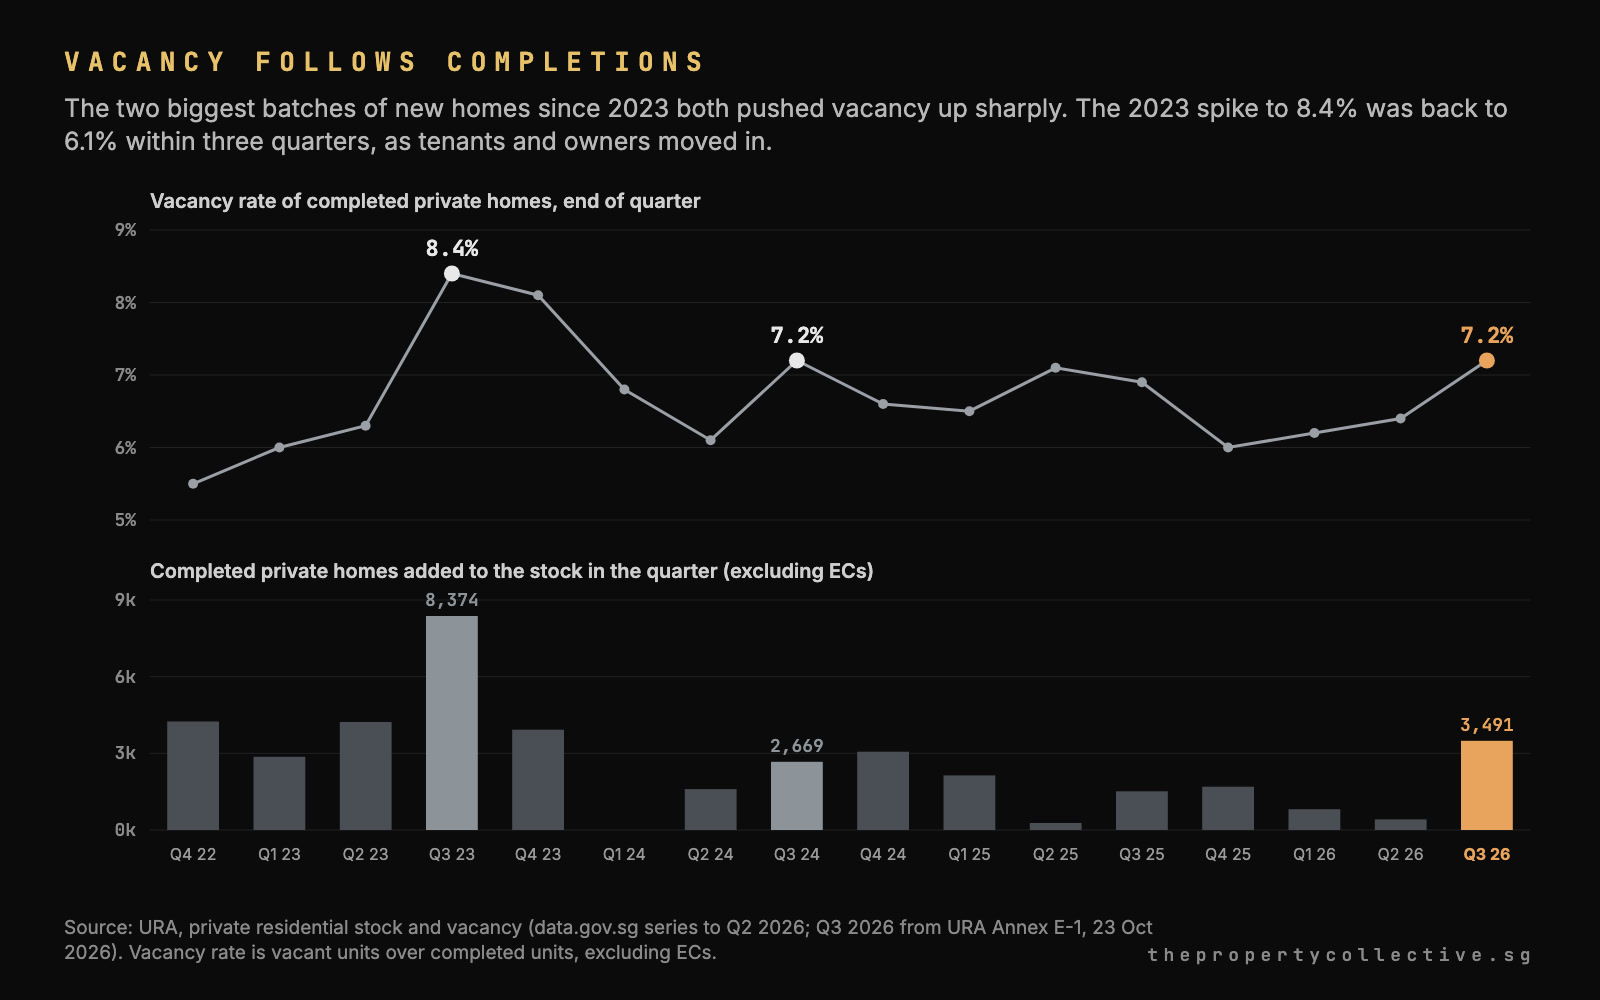
Because the vacancy jump came from new homes receiving their keys, not from tenants moving out. URA’s stock of completed private homes, excluding executive condominiums, grew by 3,491 units in the quarter and the number of vacant units grew by 3,796, while the number of occupied homes barely moved, down 305.
A home counts as vacant from the day it receives its Temporary Occupation Permit until someone moves in. Owners collect keys, renovate and furnish, and investors list and find tenants, which usually takes weeks to months. So a quarter with a large batch of completions almost always shows a vacancy spike, whatever the rental market is doing. URA counted 3,559 private homes and ECs completed in the third quarter, up from 1,212 in the second and the most in a quarter since Q3 2024.
Meanwhile, tenants signed more leases than at any time on record. PropNex, citing URA Realis data, counted 28,423 private rental contracts excluding ECs in the third quarter, 25.6% more than the 22,635 in the second quarter and the highest quarterly number since records began in 1995, as The Business Times also reported. Demand that strong pushes rents up even while new stock waits for its first occupants.
Is 7.2% a high vacancy rate for Singapore?
It is the highest since Q3 2024, when vacancy was also 7.2%, but below the 8.4% of Q3 2023 and well below the series high of about 9.7% in 1998. URA’s stock data shows the 2023 spike came with 8,374 new homes in a single quarter, and vacancy was back to 6.1% three quarters later.
Source: URA, Release of 3rd Quarter 2026 real estate statistics (23 Oct 2026) and 2nd Quarter 2026 release (24 Jul 2026). Completed private homes, excluding ECs.
| Region | Q2 2026 | Q3 2026 | Change |
|---|---|---|---|
| Core Central Region (CCR) | 8.3% | 8.4% | +0.1 pt |
| Rest of Central Region (RCR) | 6.1% | 7.4% | +1.3 pt |
| Outside Central Region (OCR) | 5.6% | 6.5% | +0.9 pt |
| All private homes | 6.4% | 7.2% | +0.8 pt |
| Executive condominiums | 4.2% | 3.4% | −0.8 pt |
The RCR and OCR, where most of this quarter’s completions sit, took the jump. The CCR barely moved, and EC vacancy fell as owners of completed ECs moved in.
Which region’s rents rose the most in Q3 2026: OCR, RCR or CCR?
The OCR. URA’s non-landed rental index for the Outside Central Region (OCR) rose 3.1% in the quarter, the Rest of Central Region (RCR) rose 1.5% and the Core Central Region (CCR) slipped 0.3%. Across the whole market, landed rents rose 2.1% and non-landed rents 1.2%.
Source: URA, Annex A-2, comparison of rental index for 2nd and 3rd Quarter 2026 (23 Oct 2026).
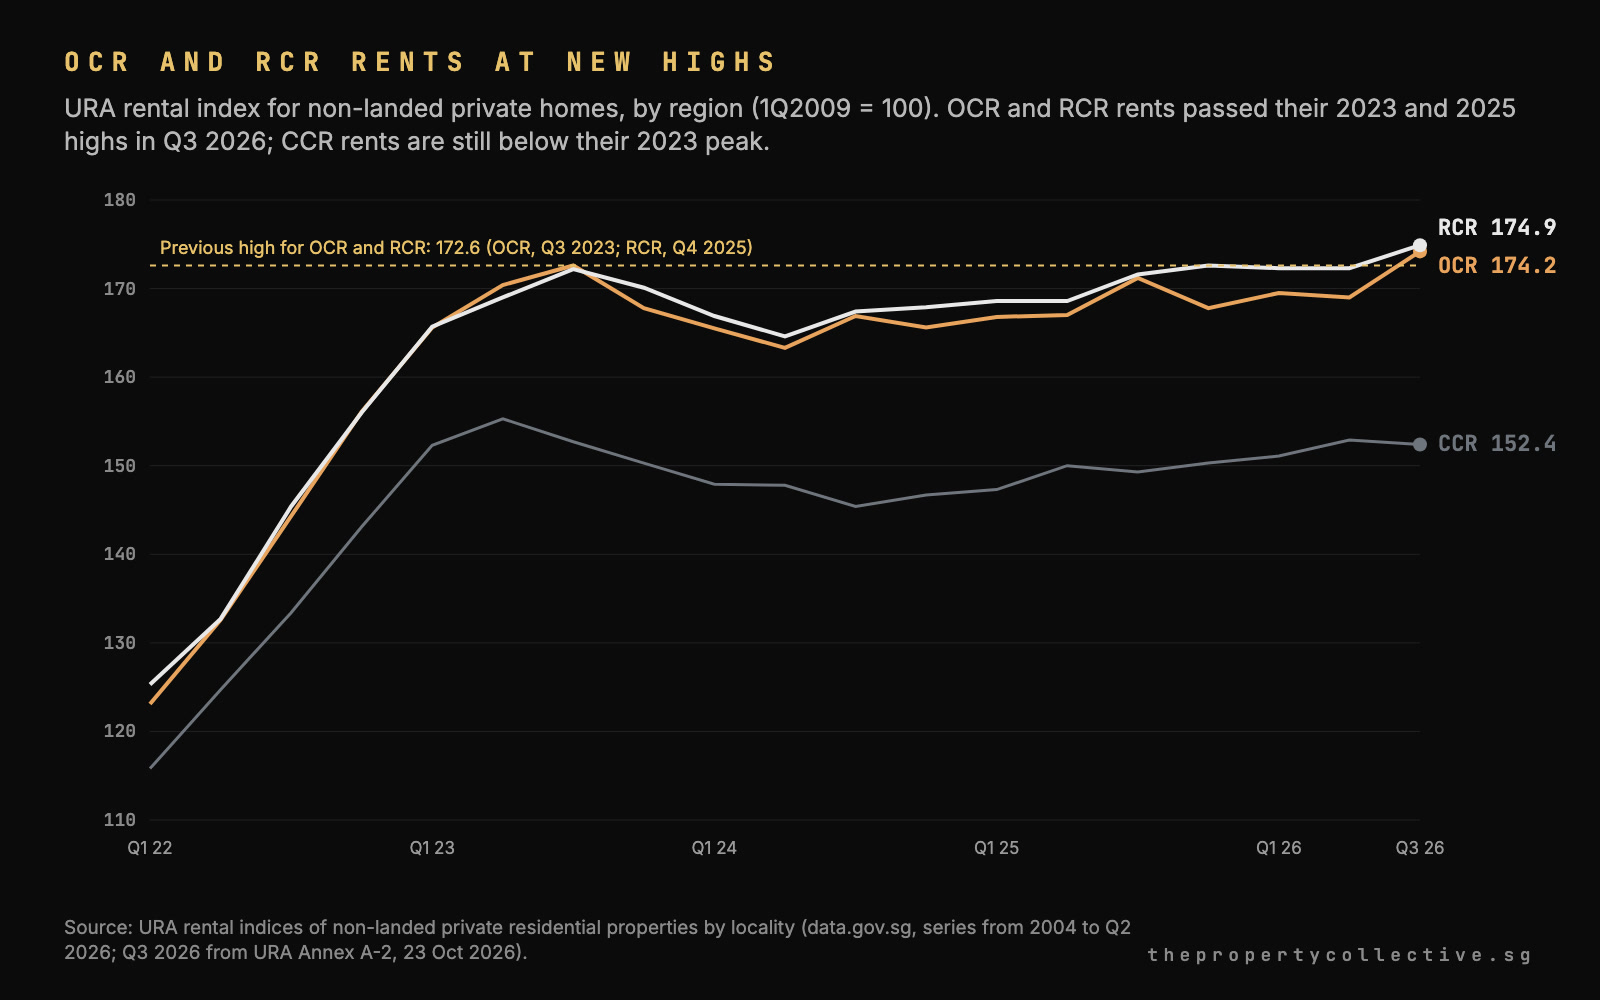
OCR, RCR and CCR are non-landed homes in each region. The OCR index went from 169.0 to 174.2 and the RCR index from 172.3 to 174.9; the CCR index fell from 152.9 to 152.4.
Those moves put the OCR and RCR rental indices at 174.2 and 174.9, the highest in URA’s regional series, which starts in 2004. The previous highs were 172.6, set by the OCR in Q3 2023 and by the RCR in Q4 2025. CCR rents, at 152.4, remain below their 2023 peak of 155.3. Across all private homes, rents are up 2.3% in the first nine months of 2026, Cushman & Wakefield calculates.
What happened to rents after the last vacancy spike?
They fell. After vacancy hit 8.4% in Q3 2023, the OCR rental index dropped from 172.6 to 163.3 by Q2 2024, a 5.4% decline over three quarters, and the RCR index fell 4.4%. The smaller 2024 spike was followed by roughly flat rents.
Source: URA stock, vacancy and rental index series (data.gov.sg) and URA quarterly releases. Rent change is our calculation from the index values three quarters later.
| Spike | Homes added that quarter | Lowest vacancy, next three quarters | OCR rents, next three quarters |
|---|---|---|---|
| Q3 2023: 8.4% | 8,374 | 6.1% (Q2 2024) | 172.6 to 163.3, −5.4% |
| Q3 2024: 7.2% | 2,669 | 6.5% (Q1 2025) | 166.9 to 167.0, flat |
| Q3 2026: 7.2% | 3,491 | to be seen | to be seen |
The 2023 fall also reflected the end of the post-Covid rental surge, when the OCR index had risen about 49% in the previous two years, so it overstates what completions alone do. The pattern that does repeat: vacancy spikes fade within a few quarters, and the rent effect depends on how much new stock arrives next.
This time the starting point is different. Rents are rising into the spike rather than coming off a boom, and leasing demand just set a record. That argues for the 2024 pattern, a pause rather than a fall, as long as the next wave of completions is absorbed. Our 2027 playbook set out why that next wave matters.
Will Singapore condo rents fall in 2027?
Not on current forecasts, but growth is likely to slow as completions rise. URA’s pipeline now puts 10,132 private homes and ECs at TOP in 2027, up from 9,704 a quarter ago, after an estimated 7,783 private completions in 2026.
Sources: URA, Annex E-3, pipeline by expected year of completion as at Q3 2026 (23 Oct 2026); Cushman & Wakefield (26 Oct 2026); CBRE as reported by The Business Times (23 Oct 2026).
| Period | Completions expected | Rental outlook |
|---|---|---|
| Q4 2026 | 2,613 private homes (2026 total: 8,655 with ECs) | Cushman & Wakefield: up to +3% for 2026; CBRE: +2% to +3% |
| 2027 | 10,132 (8,868 private, 1,264 EC) | No published calls yet; about 17% more than 2026 |
| 2028 | 9,587 (8,239 private, 1,348 EC) | Down from 11,204 in the June pipeline |
| 2029 | 8,165, including 605 awaiting approval | Pipeline thins |
Cushman & Wakefield puts 2026 private completions at 7,783, below the 10-year average of 10,837 a year. The 2027 figure is about 17% above 2026’s 8,655 homes including ECs, and the most in any year until at least 2029, which is why we expect rent growth to slow next year rather than continue at the third quarter’s pace.
The research houses are not calling a fall. Cushman & Wakefield expects rents to rise up to 3% in 2026, supported by a constrained supply pipeline and steady demand from international students. CBRE expects 2% to 3%, but its research head Tricia Song cautioned that leasing may take longer as tenants become more selective and landlords compete for quality occupants, especially amid slower hiring conditions, The Business Times reported. Our read: rents hold at today’s level through the first half of 2027 and then flatten as the 2027 completions land, with the CCR the weakest segment because it is already soft and carries the highest vacancy.
What should landlords and tenants do now?
What we are watching next
URA’s fourth-quarter flash estimate in early January will show whether rents held after the spike, and the full data in late January will show whether vacancy fell back as the third quarter’s new homes filled. We are also watching the rental contract count, which tells you about demand before the index does, and where the 2,613 homes due in the fourth quarter sit. For the HDB side of the same release, see our read of HDB’s third straight quarterly dip.
Next: the 2027 playbook, from MOP flats to private completions →
Sources
- URA: Release of 3rd Quarter 2026 real estate statistics (23 Oct 2026)
- URA: Annex A-2, comparison of rental index for 2nd and 3rd Quarter 2026
- URA: Annex E-1, stock and vacancy and supply in the pipeline as at end of 3rd Quarter 2026
- URA: Annex E-3, pipeline supply by expected year of completion as at 3rd Quarter 2026
- URA: Release of 2nd Quarter 2026 real estate statistics (24 Jul 2026)
- URA: Release of 4th Quarter 2023 real estate statistics, vacancy 8.4% in Q3 2023 and 8.1% in Q4 2023 (2024)
- data.gov.sg (SingStat, source URA): Available and vacant private residential properties, quarterly
- data.gov.sg (SingStat, source URA): Rental indices of non-landed private residential properties by locality, quarterly
- The Business Times: Home sales set to recover in Q4 with prices seen rising further on new launch momentum (23 Oct 2026)
- Cushman & Wakefield: Comments on URA real estate statistics for Q3 2026 (26 Oct 2026)
- PropNex: Q3 2026 market commentary, private rental contracts from URA Realis (23 Oct 2026)
Renewing a lease, pricing a vacant unit or deciding whether to keep renting it out? We read your unit against the latest contracts in your project and the completions landing around it, then tell you what rent will actually let.
Keep reading
Related notes.

One bid, $1,243 psf ppr: what EL Development’s Marina Gardens Lane offer means for Marina South and One Marina Gardens.
The Marina Gardens Lane tender closed on 15 October with a single envelope: EL Development at $450.1 million, or $1,243 psf per plot ratio. That is 11% below what Kingsford paid next door for One Marina Gardens, and under the $1,350 to $1,650 analysts expected. Here is what the number does to the precinct, to One Marina Gardens’ buyers, and to anyone waiting for a cheaper way in.
The 2027 playbook: 15,000 HDB flats reach MOP, not one EC does, and private completions rise 29%.
About 15,000 HDB flats reach the end of their MOP in 2027, on top of roughly 19,600 new flats a year. Not a single executive condominium reaches its MOP between October 2025 and January 2028. Private completions rise to 9,704 next year and peak in 2028, while the population adds 97,000 people and about 23,000 households a year. Here is what those numbers do to each market, and what to do about it.
Three quarters down, 0.6% in total. What HDB’s Q3 flash really says about resale prices.
HDB’s flash estimate puts the Q3 2026 Resale Price Index at 202.4, down 0.2% and the third straight quarterly dip, while URA’s private index jumped 1.4%. Volumes rose 17.7%, million-dollar flats hit 597, and the gap between an HDB flat and the condo it is meant to fund widened again. Here is what the number does and does not mean.
Figures. Vacancy, rent, completion and pipeline figures are URA’s, as published on 23 October 2026. Historical vacancy rates are our calculation from URA’s stock and vacancy series on data.gov.sg and match URA’s published rates; the 1998 high and the three-quarter rent changes are our calculations from the same series. The rental contract count is from URA Realis as reported by PropNex and The Business Times. Forecasts are those firms’ views, not ours.
Not financial advice. This is market commentary, not a recommendation to buy, sell or let any property. Rents for a specific unit depend on the project, the floor, the furnishing and the timing; speak to us or your own adviser about your situation.
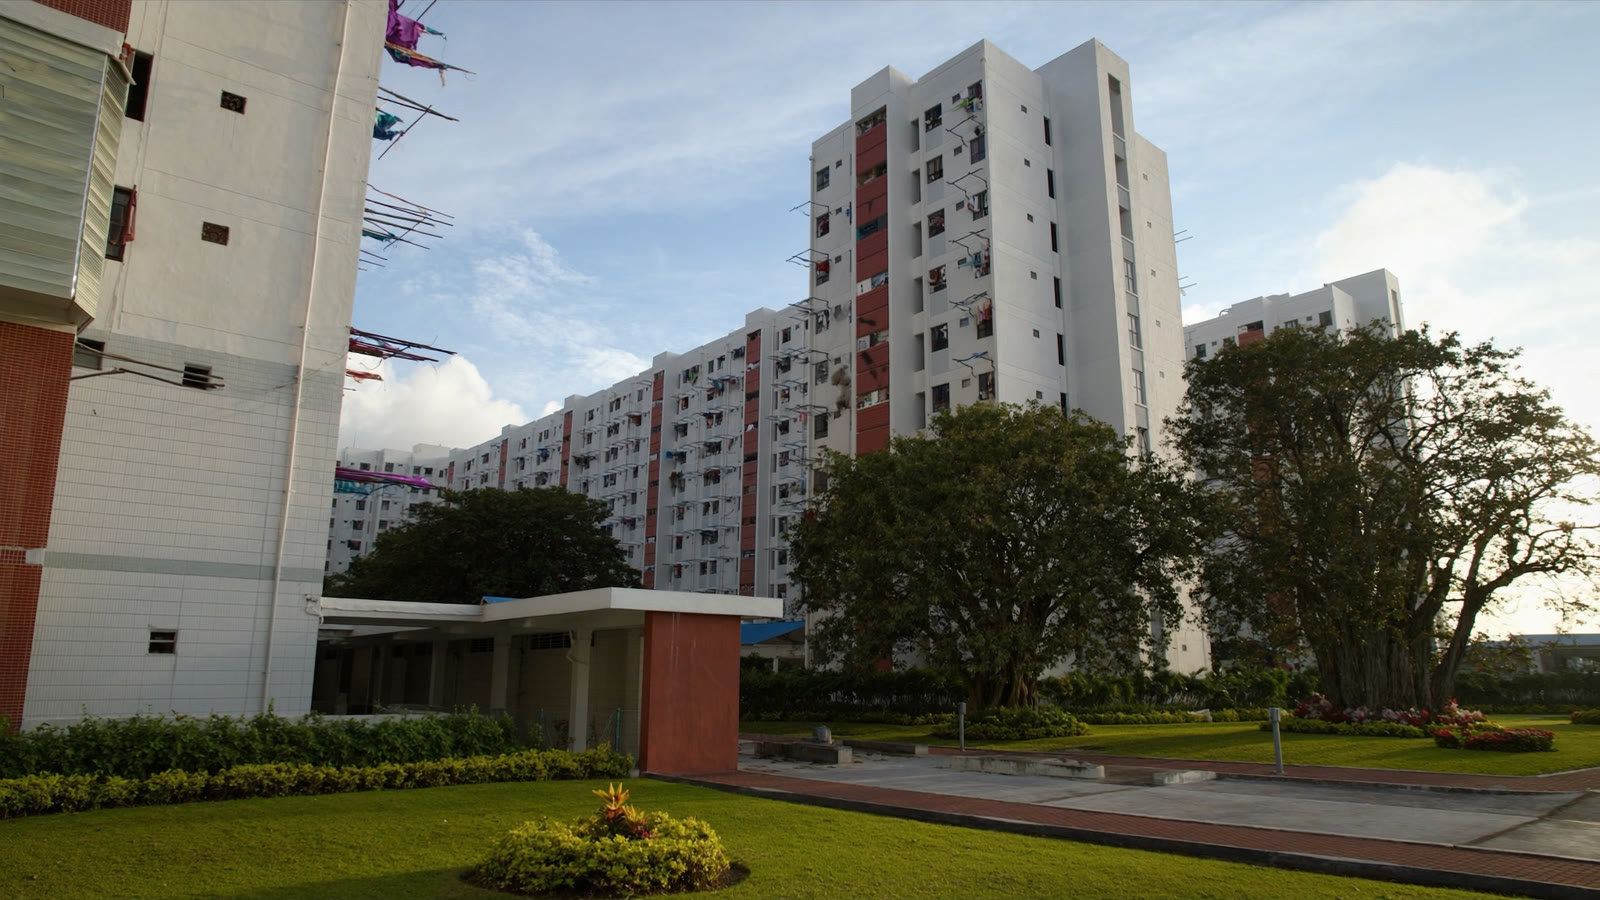
Illustration. The header image is an AI-generated illustration of a suburban condominium cluster, not a photograph of any development named here.
Independent. The Property Collective is a team within PropNex Realty. We are not affiliated with URA, Cushman & Wakefield or CBRE.